Profiler
Visual waterfall timeline of binding operations
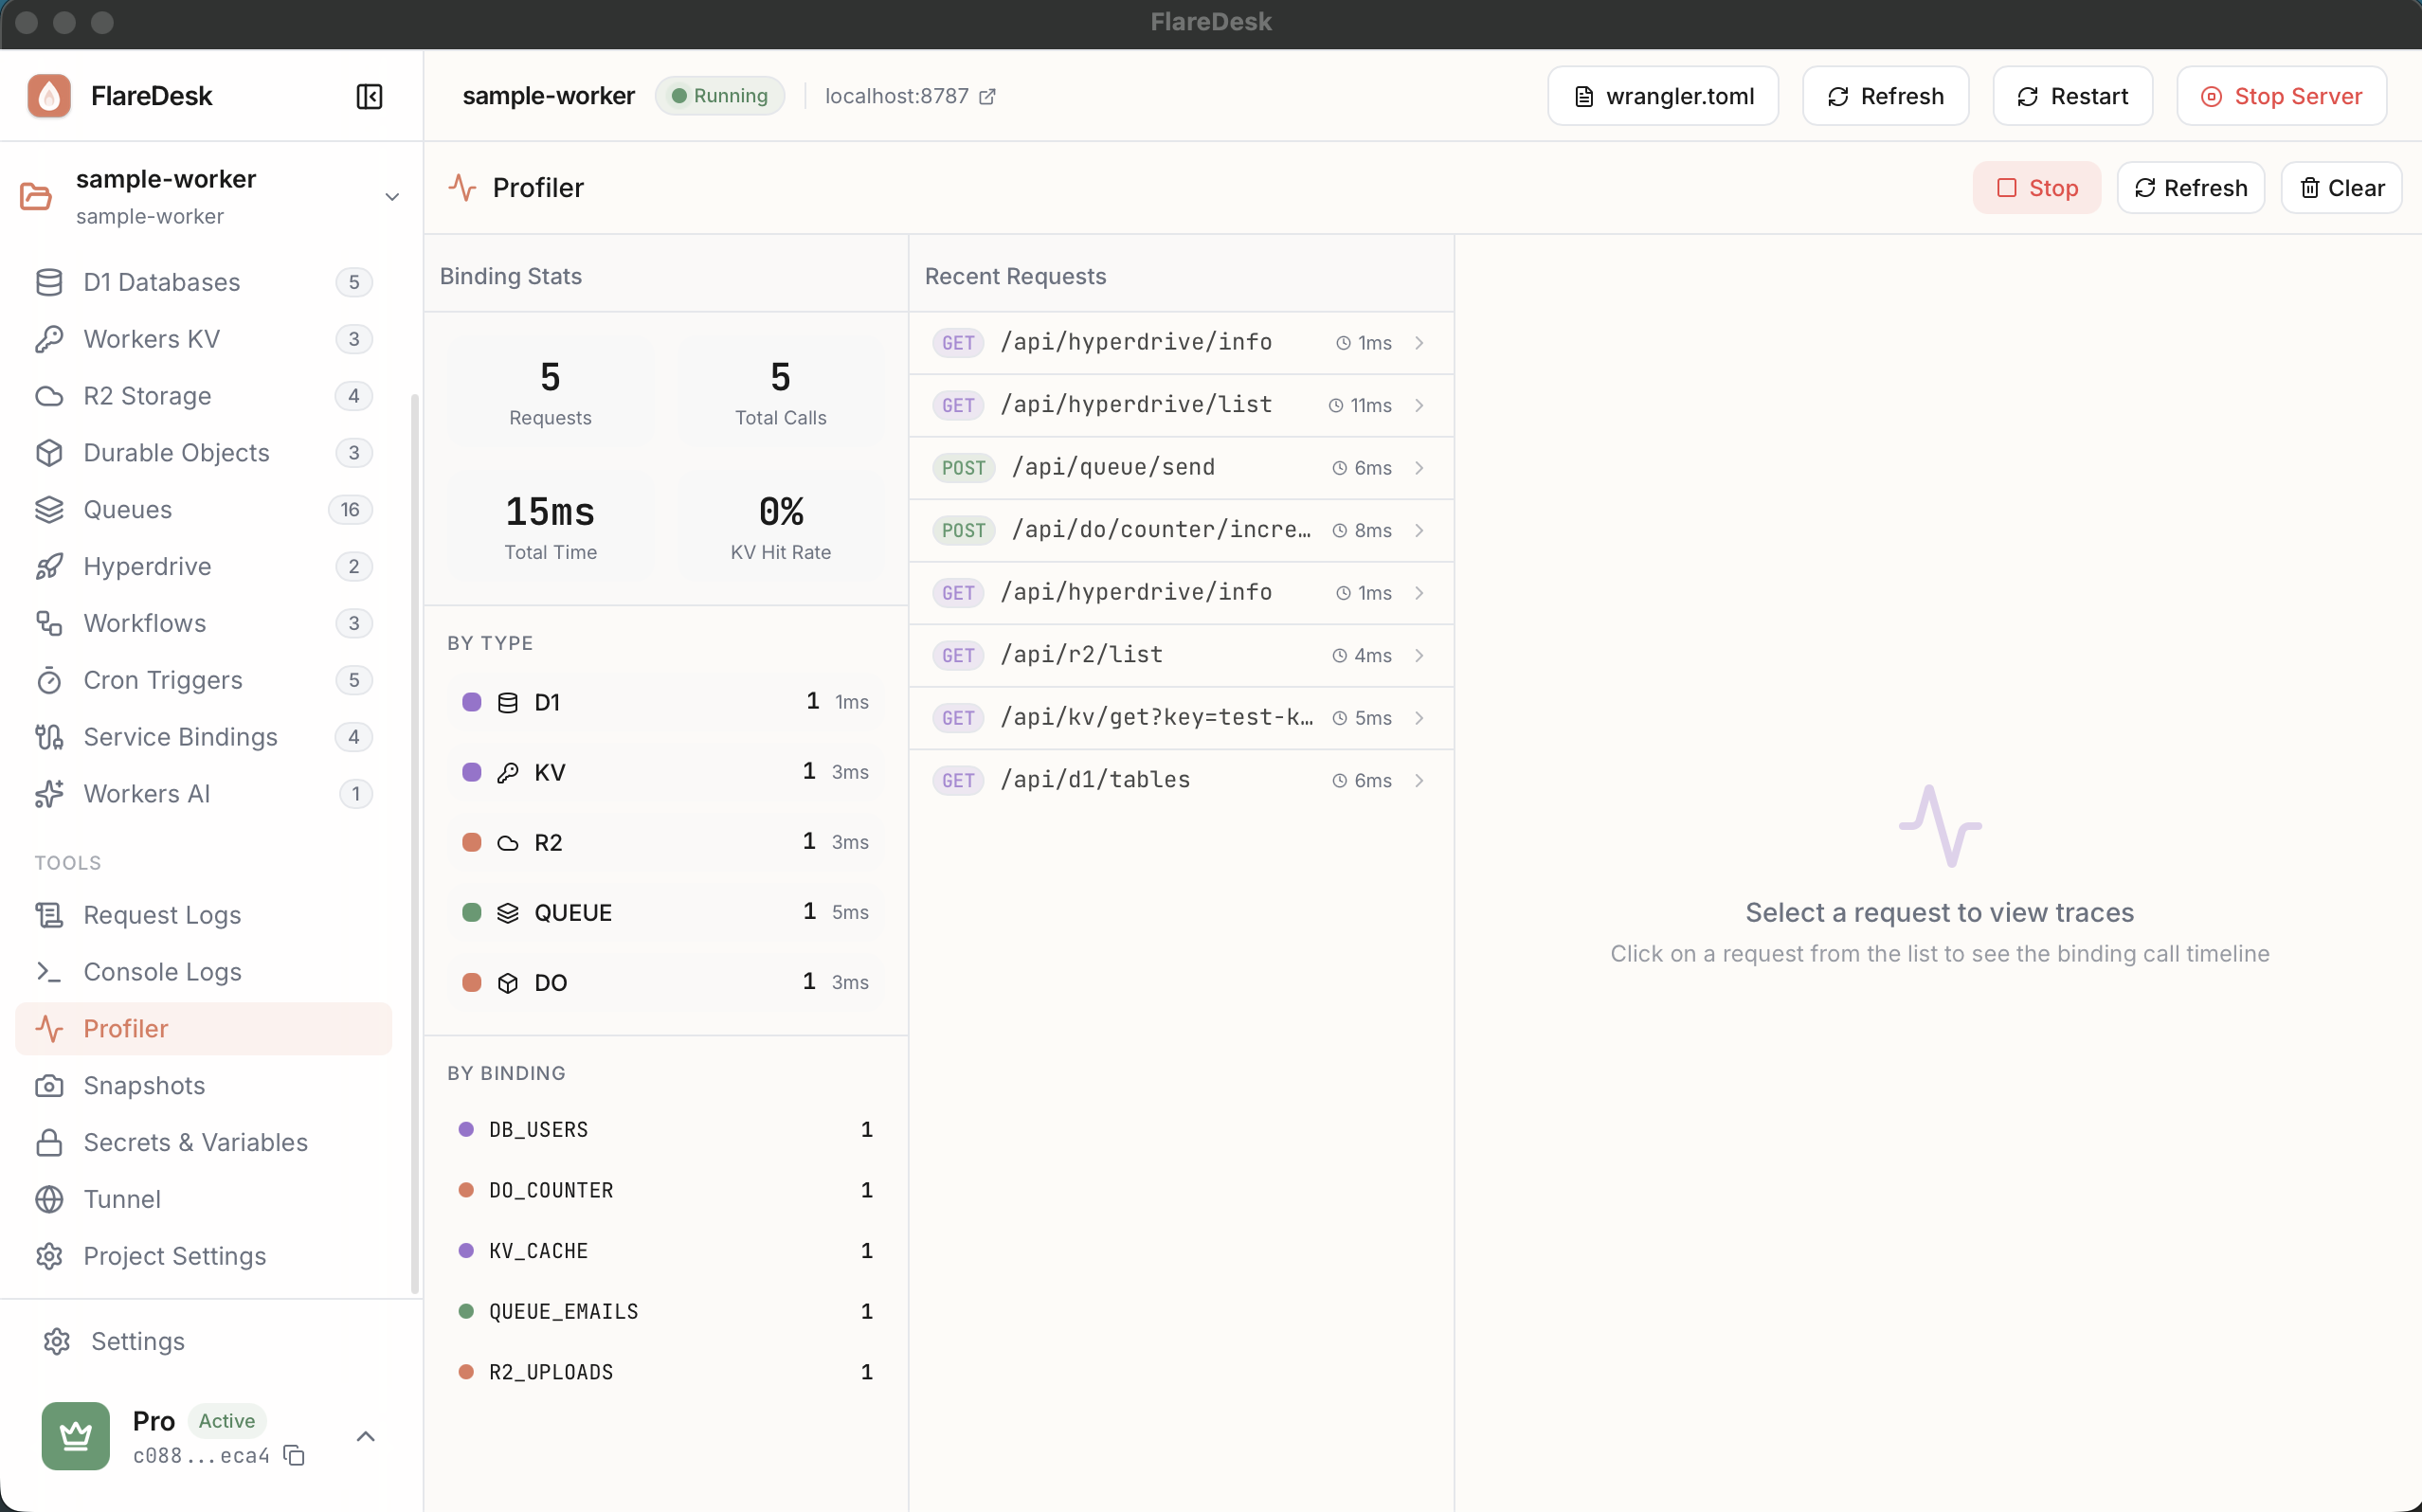
The Visual Request Profiler helps you understand the performance of your Worker by showing all binding operations in a waterfall timeline view.
Overview
Waterfall View
See all operations visualized as a timeline
Timing Details
Duration of each binding operation
Statistics
Aggregate metrics for all calls
Error Tracking
Identify failed operations
What Gets Tracked
The profiler tracks operations for all binding types:
- D1: SQL queries and their execution time
- KV: Get, put, list, and delete operations
- R2: Object reads, writes, and deletes
- Queues: Message send operations
- Durable Objects: Storage operations and fetches
Enabling the Profiler
The profiler must be enabled in Project Settings:
- 1
Go to Project Settings
- 2
Find the "Developer Tools" section
- 3
Toggle "Binding Profiler" on
- 4
Restart the dev server for changes to take effect
Using the Profiler
- 1
Navigate to Logs in the sidebar
- 2
Click the "Profiler" tab
- 3
Make requests to your Worker
- 4
View the waterfall timeline for each request
Understanding the Timeline
The waterfall view shows:
Each Bar Represents
- A single binding operation
- The horizontal length shows duration
- The position shows when it started relative to the request
Color Coding
- D1 operations
- KV operations
- R2 operations
- Queue operations
- Durable Object operations
Details Panel
Click any bar to see operation details: binding name, operation type, parameters, and result.
Statistics
The profiler also shows aggregate statistics:
- Total calls: Number of binding operations
- Total time: Combined duration of all operations
- Average time: Mean operation duration
- By binding type: Breakdown per binding category
- Errors: Count of failed operations
Performance Tips
Look for Sequential Operations
Operations that could run in parallel but appear sequential are optimization opportunities.
Identify Slow Operations
Long bars indicate slow operations. Consider caching or optimizing these.
Reduce Total Calls
Batch operations when possible. Multiple KV gets can sometimes be replaced with a list.
Minimal Performance Impact
The profiler uses a "fire-and-forget" pattern:
- Trace data is sent asynchronously using
ctx.waitUntil() - Your Worker's response time is not affected
- Profiling does not block request processing